Difference between revisions of "Input-Output Matrix"
Wiki admin (talk | contribs) |
Wiki admin (talk | contribs) |
||
| Line 1: | Line 1: | ||
== Definition == | == Definition == | ||
| − | The '''Industry Transaction Matrix''' (o Transactions Table) is the fundamental quantitative information used in [[Input-Output Analysis]]. It concerns the flow of products from each industrial sector (considered as a producer) to each of the sectors, itself and others (considered as consumers). | + | The '''Industry Transaction Matrix''' (o Transactions Table) is the fundamental quantitative information used in [[Input-Output Analysis]]. It concerns the flow of products from each industrial sector (considered as a producer) to each of the sectors, itself and others (considered as consumers).<ref>R.E. Miller and P.D. Blair, Input-Output Analysis: Foundations and Extensions, Second Edition, Cambridge University Press, 2009</ref> |
== Formula == | == Formula == | ||
| − | + | ||
| + | === Single Region Case === | ||
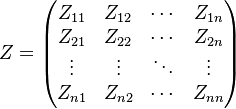
| + | Usually denoted as Z, if there are n sectors in an economy the matrix reads: | ||
:<math> | :<math> | ||
| Line 19: | Line 21: | ||
* The entries of the matrix may denote either monetary values (in some defined currency) or physical (activity) values, e.g. volumes. | * The entries of the matrix may denote either monetary values (in some defined currency) or physical (activity) values, e.g. volumes. | ||
* The matrix is a flow matrix, hence values refer to a particular time period. | * The matrix is a flow matrix, hence values refer to a particular time period. | ||
| + | |||
| + | === Multi-Region Case === | ||
== Usage == | == Usage == | ||
This basic information from which an input-output model is developed is contained in an interindustry transactions table. The rows of such a table describe the distribution of a producer’s output throughout the economy. The columns describe the composition of inputs required by a particular industry to produce its output. | This basic information from which an input-output model is developed is contained in an interindustry transactions table. The rows of such a table describe the distribution of a producer’s output throughout the economy. The columns describe the composition of inputs required by a particular industry to produce its output. | ||
| − | The Matrix is of fundamental importance and may underpin alternative possible [[Input-Output Model | input-output models]]. | + | The Transaction Matrix is of fundamental importance and may underpin alternative possible [[Input-Output Model | input-output models]]. |
| + | |||
| + | == See Also == | ||
| + | * [[Technical Coefficient Matrix]] | ||
| + | * [[Final Demand]] | ||
| + | * [[Total Output]] | ||
Revision as of 14:40, 2 March 2022
Contents
Definition
The Industry Transaction Matrix (o Transactions Table) is the fundamental quantitative information used in Input-Output Analysis. It concerns the flow of products from each industrial sector (considered as a producer) to each of the sectors, itself and others (considered as consumers).[1]
Formula
Single Region Case
Usually denoted as Z, if there are n sectors in an economy the matrix reads:
- The entries of the matrix may denote either monetary values (in some defined currency) or physical (activity) values, e.g. volumes.
- The matrix is a flow matrix, hence values refer to a particular time period.
Multi-Region Case
Usage
This basic information from which an input-output model is developed is contained in an interindustry transactions table. The rows of such a table describe the distribution of a producer’s output throughout the economy. The columns describe the composition of inputs required by a particular industry to produce its output.
The Transaction Matrix is of fundamental importance and may underpin alternative possible input-output models.
See Also
References
- ↑ R.E. Miller and P.D. Blair, Input-Output Analysis: Foundations and Extensions, Second Edition, Cambridge University Press, 2009