Difference between revisions of "Histogram"
From Open Risk Manual
Wiki admin (talk | contribs) |
Wiki admin (talk | contribs) |
||
| Line 20: | Line 20: | ||
[[Category:Visualization]] | [[Category:Visualization]] | ||
| + | [[Category:Statistics]] | ||
Latest revision as of 14:54, 18 October 2021
Definition
A Histogram is a numerical approximation (and associated visual depiction) of the observed (sampled) distribution of a continuous Random Variable after its range has been suitably decomposed into a numbef of bins. The bins are typically consecutive and non-overlapping intervals of a variable.
Formula
If  is the set of N observed values, k is the number of distinct bins, and
 ![B_i = [L_i, R_i]](https://www.openriskmanual.org/wiki/images/mathdata/4/6/b/46b1bf763180ca630dff4bbfe42697bc.png) are the left and right boundaries of the i-th bin, then the histogram is the function that counts how many observations fall into each bin.
are the left and right boundaries of the i-th bin, then the histogram is the function that counts how many observations fall into each bin.
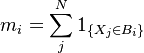
Hence the sum
